
NielFlamm.com Keeps Going Global: 19 Million Characters and Counting
A few days ago, I shared the translation activity for NielFlamm.com. The numbers impressed me then—and apparently the translation engine decided it was just getting warmed up.
Here is how the latest 30-day statistics compare:
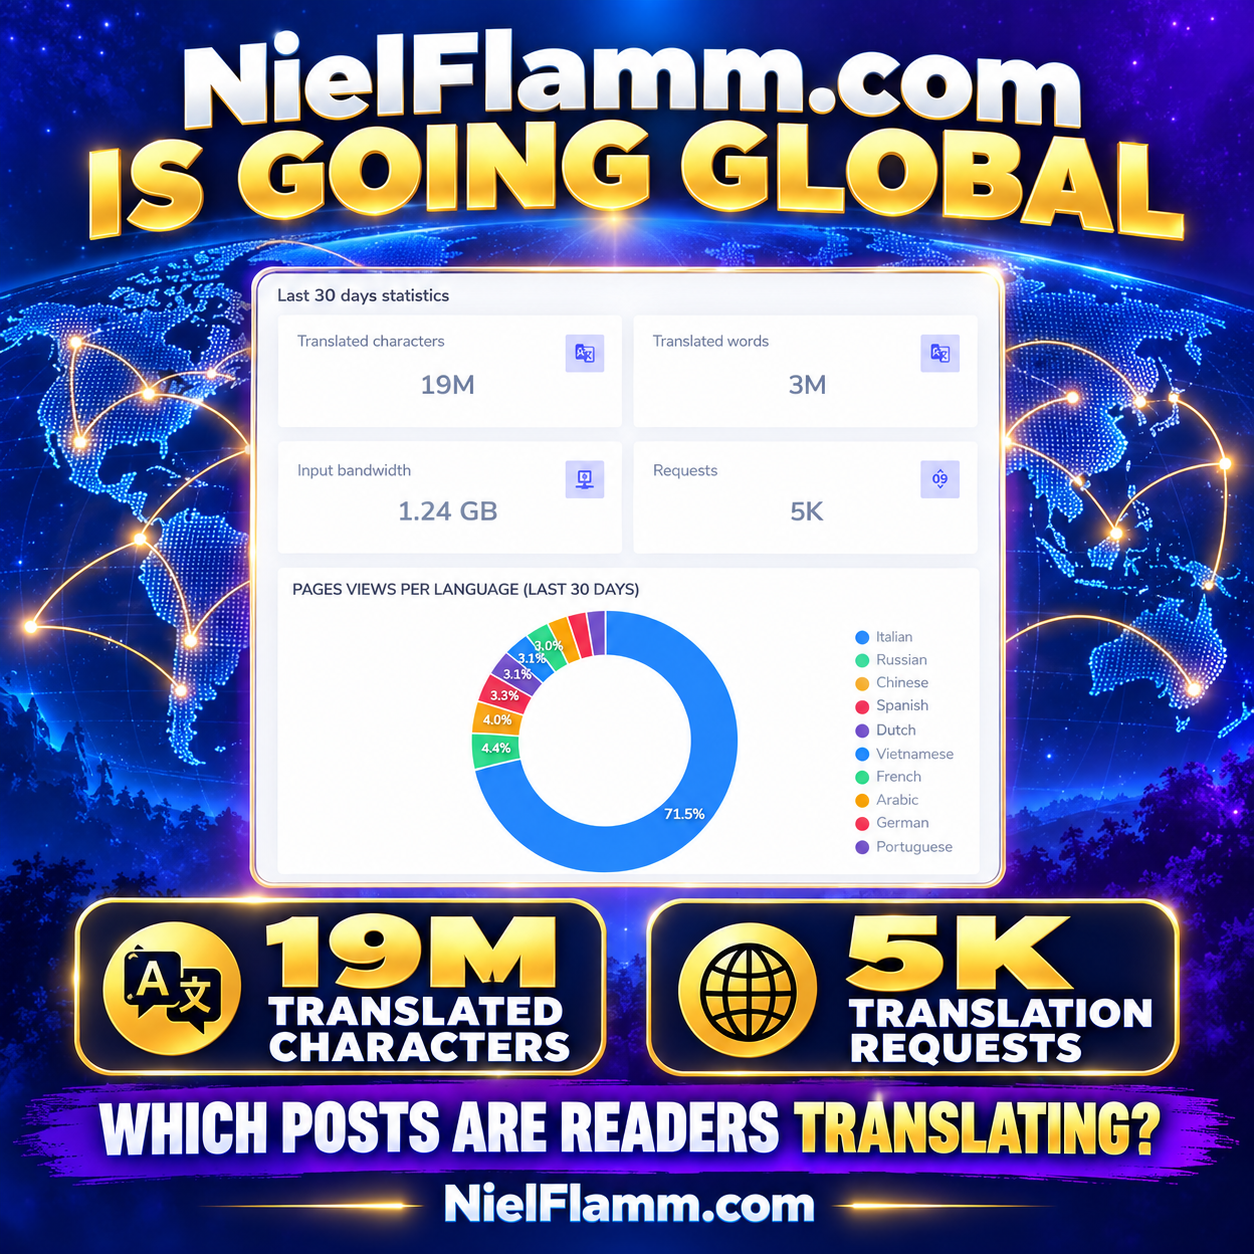
Translated characters: 18 million to 19 million
Translated words: Holding steady at 3 million
Input bandwidth: 1.2 GB to 1.24 GB
Translation requests: 4,000 to 5,000
That means another one million characters were translated, while requests increased by 25%. Not bad for a website operated by one bald guy in South Carolina.
The language rankings also shifted.
Italian remains firmly in first place, although its share decreased from 75.8% to 71.5% as other languages gained ground. Russian moved into second place at 4.4%, followed by Chinese at 4.0% and Spanish at 3.3%. Dutch and Vietnamese were tied at 3.1%, with French close behind at 3.0%.
Previously, Italian was followed by Spanish and Vietnamese. Seeing Russian and Chinese climb the rankings shows that the audience is becoming more geographically diverse—which was the entire reason for adding translation options.
What I really want to know is: Which posts are all these readers translating?
Are they reading my movie reviews, health updates, travel stories, scam warnings, Nextdoor adventures, or dating-app experiments? Perhaps somewhere in Italy, someone is translating one of my posts and wondering, “What exactly is going on with this bald American?”
If you use the translation feature, please let me know which posts brought you to the website and which language you selected.
I recently added Thai and Czech. They have not cracked the top rankings yet, but I’ll give them time. Rome wasn’t translated in a day.
Thank you to everyone reading, watching, and exploring NielFlamm.com in whichever language feels most comfortable. These may be numbers on a dashboard, but each request shows that the content is reaching beyond its original language.
I appreciate every one of you.
Lost in Translation—in the Best Possible Way
After uploading my vlog about Resident Evil 2026—which you should definitely check out—I decided to peek at the translation metrics for my website.
Honestly, I hadn’t checked the translation API in quite some time. Apparently, while I wasn’t paying attention, the internet was busy translating.
The numbers impressed me:
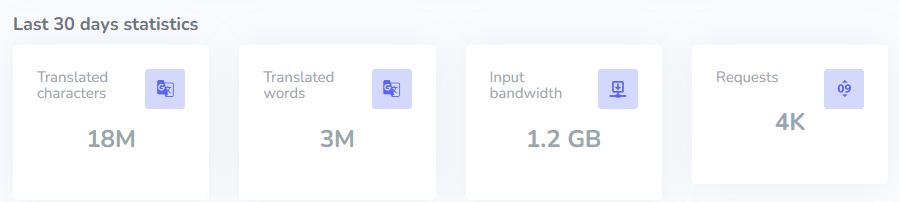
18 million characters translated
3 million words translated
4,000 translation requests
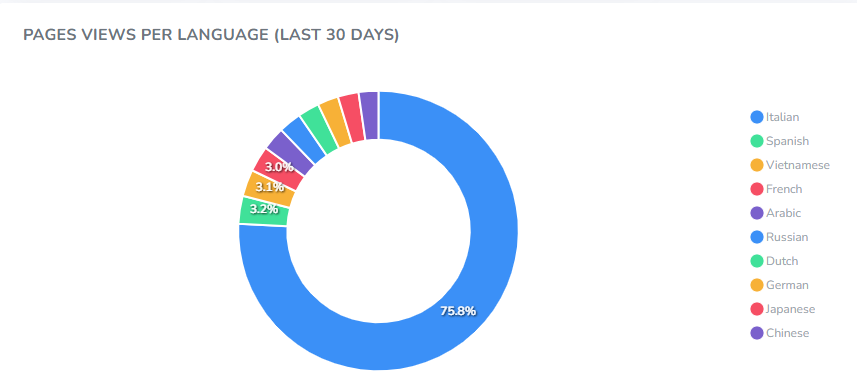
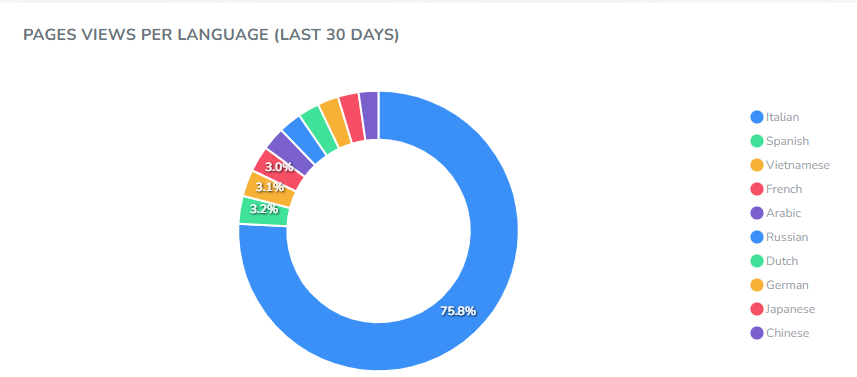
Italian generated the most page views by language, followed by Spanish and Vietnamese. Chinese came in last, which surprised me because China has previously been one of the top sources of traffic to my website.
Today, I added two more languages: Thai and Czech.
I added Thai because I hope to spend part of my remaining years living in Thailand. If I’m going to enjoy the beaches, food, culture, and hopefully a beachfront view, it seems only fair that Thai readers can enjoy my adventures—and occasional misadventures—in their own language.
Czech was also added because the more people who can read and watch my content, the better. My website is slowly becoming more multilingual than I am. I’m still working on English some days.
To everyone who has visited, read a blog post, watched a video, or translated my content: thank you.
These numbers may not break the internet, but they mean a great deal to me. I truly enjoy bringing this content to you and sharing the strange, funny, serious, and unexpected moments of my life.
Thank you for reading, watching, and joining me on the journey—wherever in the world you may be.
📊 The Good, the Bad, and the Website Metrics
Transparency matters.
One of the things I want to do with NielFlamm.com is share the journey—the wins, the losses, and everything in between. So today, I thought I'd pull back the curtain a bit.
First, thank you.
Seriously.
Whether you've visited once, read a blog post, watched one of my movie reviews, listened to a podcast, or stopped by to see what kind of internet garbage I posted this week, I appreciate you. Even more, thank you to everyone who has taken the time to send feedback, leave comments, or reach out directly. It means more than you probably realize.
Now for the numbers.
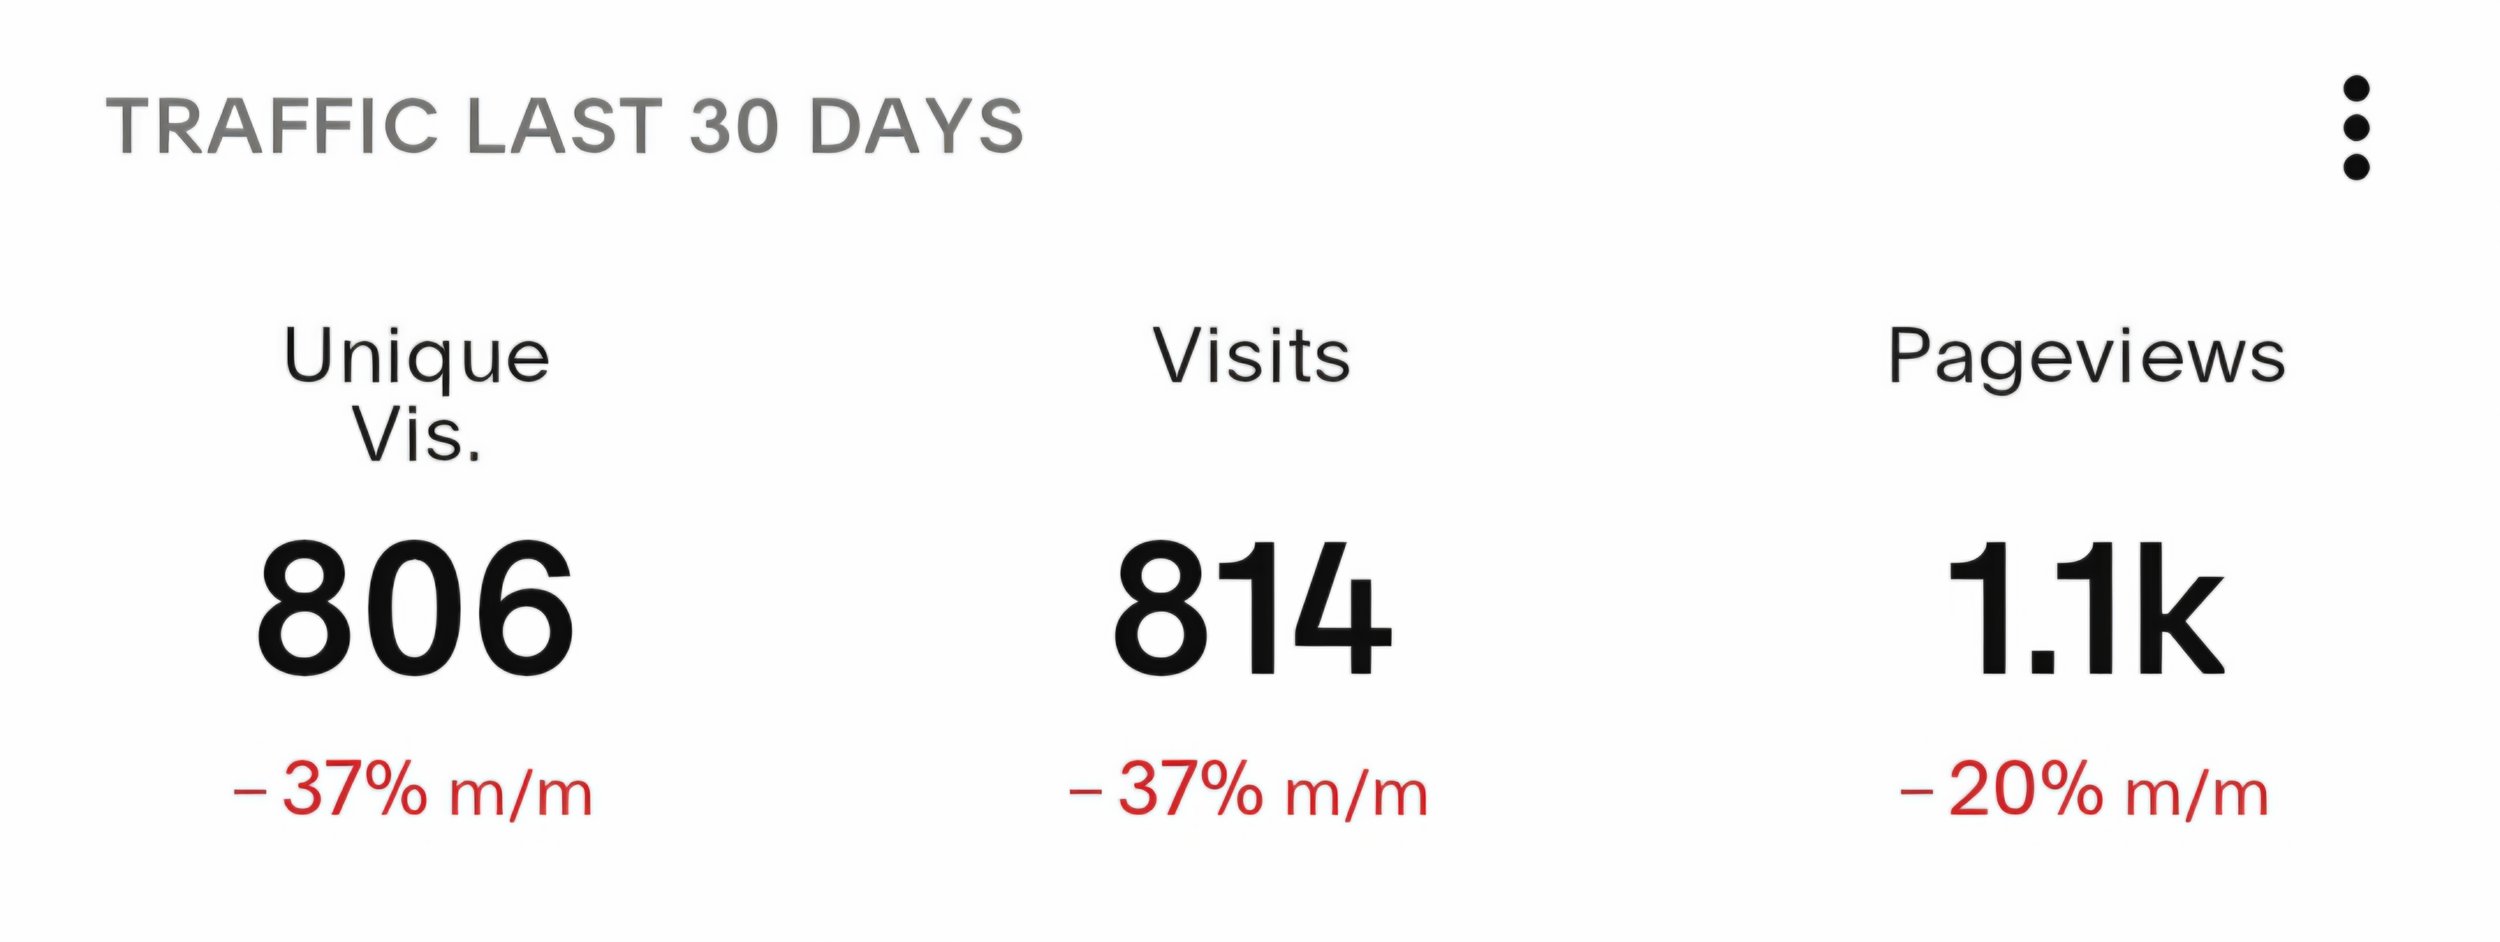
Compared to last month:
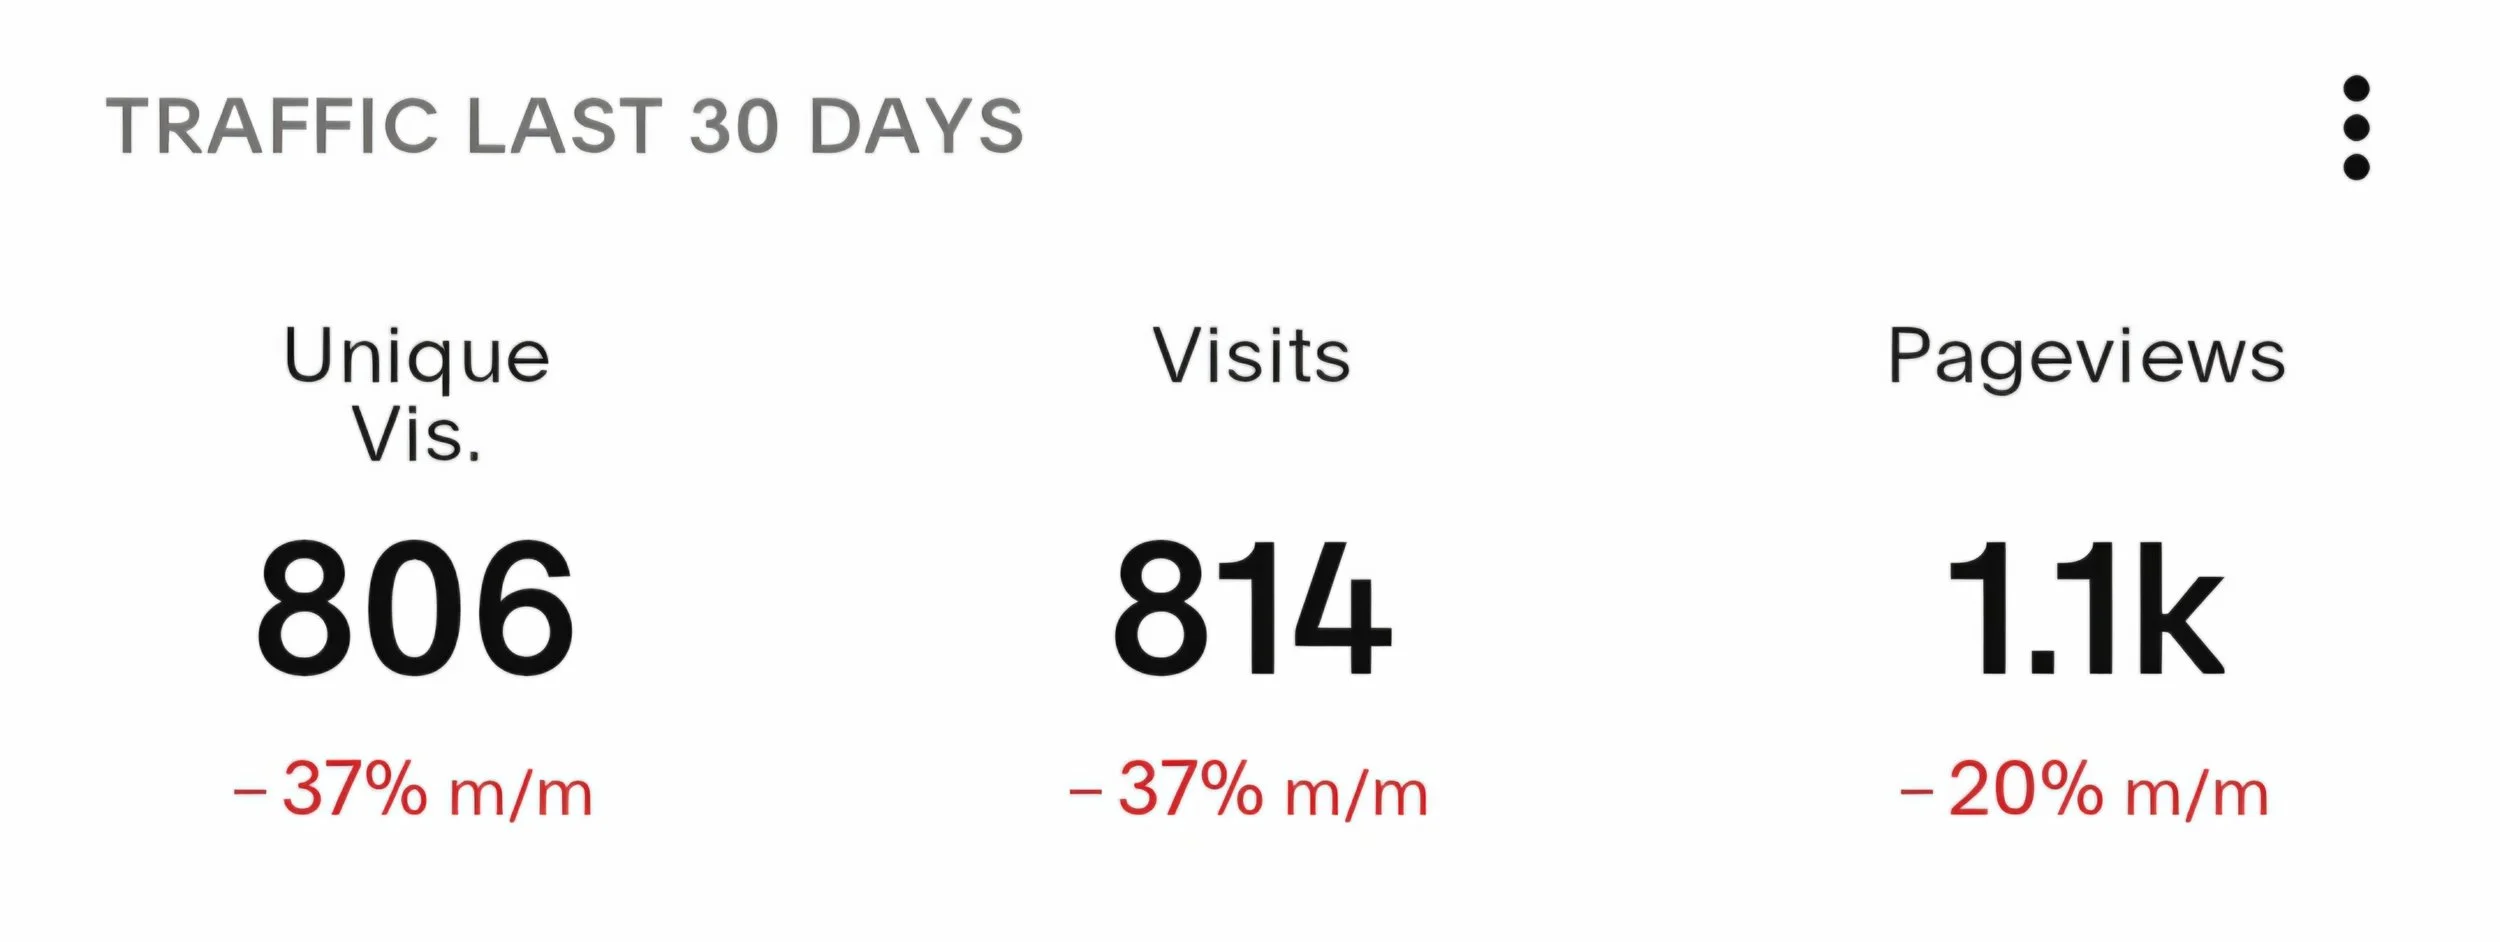
Unique Visits are down about 37%.
Visits are also down about 37%.
Page Views are down about 20%.
Do I love seeing that? Of course not.
Do I panic? Also no.
The reality is... I don't know exactly why.
It could be seasonal. Summer vacations, kids out of school, people spending more time outside than staring at another screen (probably a healthy decision).
It could be that social media algorithms decided my posts should be shown to approximately three people, and one of them was probably my mom.
It seems my content isn’t resonating as much.
Maybe people are just busy.
Maybe search engine rankings shifted.
Maybe some readers are waiting for me to write about something they're especially interested in.
Or maybe the internet decided to internet.
The honest answer is... I don't know.
I enjoy creating content, and I'm continuing to invest in making the site better.
Over the last couple of months, I've added a few tools.
I've talked quite a bit about using ChatGPT to help organize ideas and polish content. My website is hosted on Squarespace, and I recently added Linguise to provide translations into multiple languages.
None of these companies are sponsors...
...yet. 😄
One interesting thing Linguise lets me see is which translated versions of the site are being viewed.
The results surprised me.
The most viewed translated language?
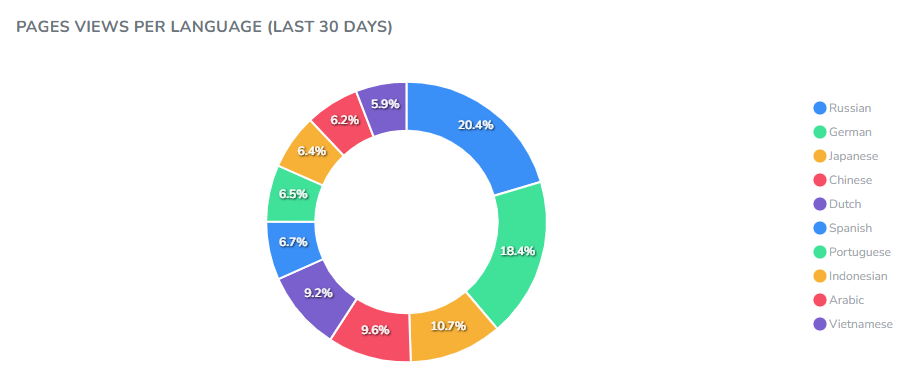
Russian.
That's right...
Russian.
Tell Comrade Putin I said hello.
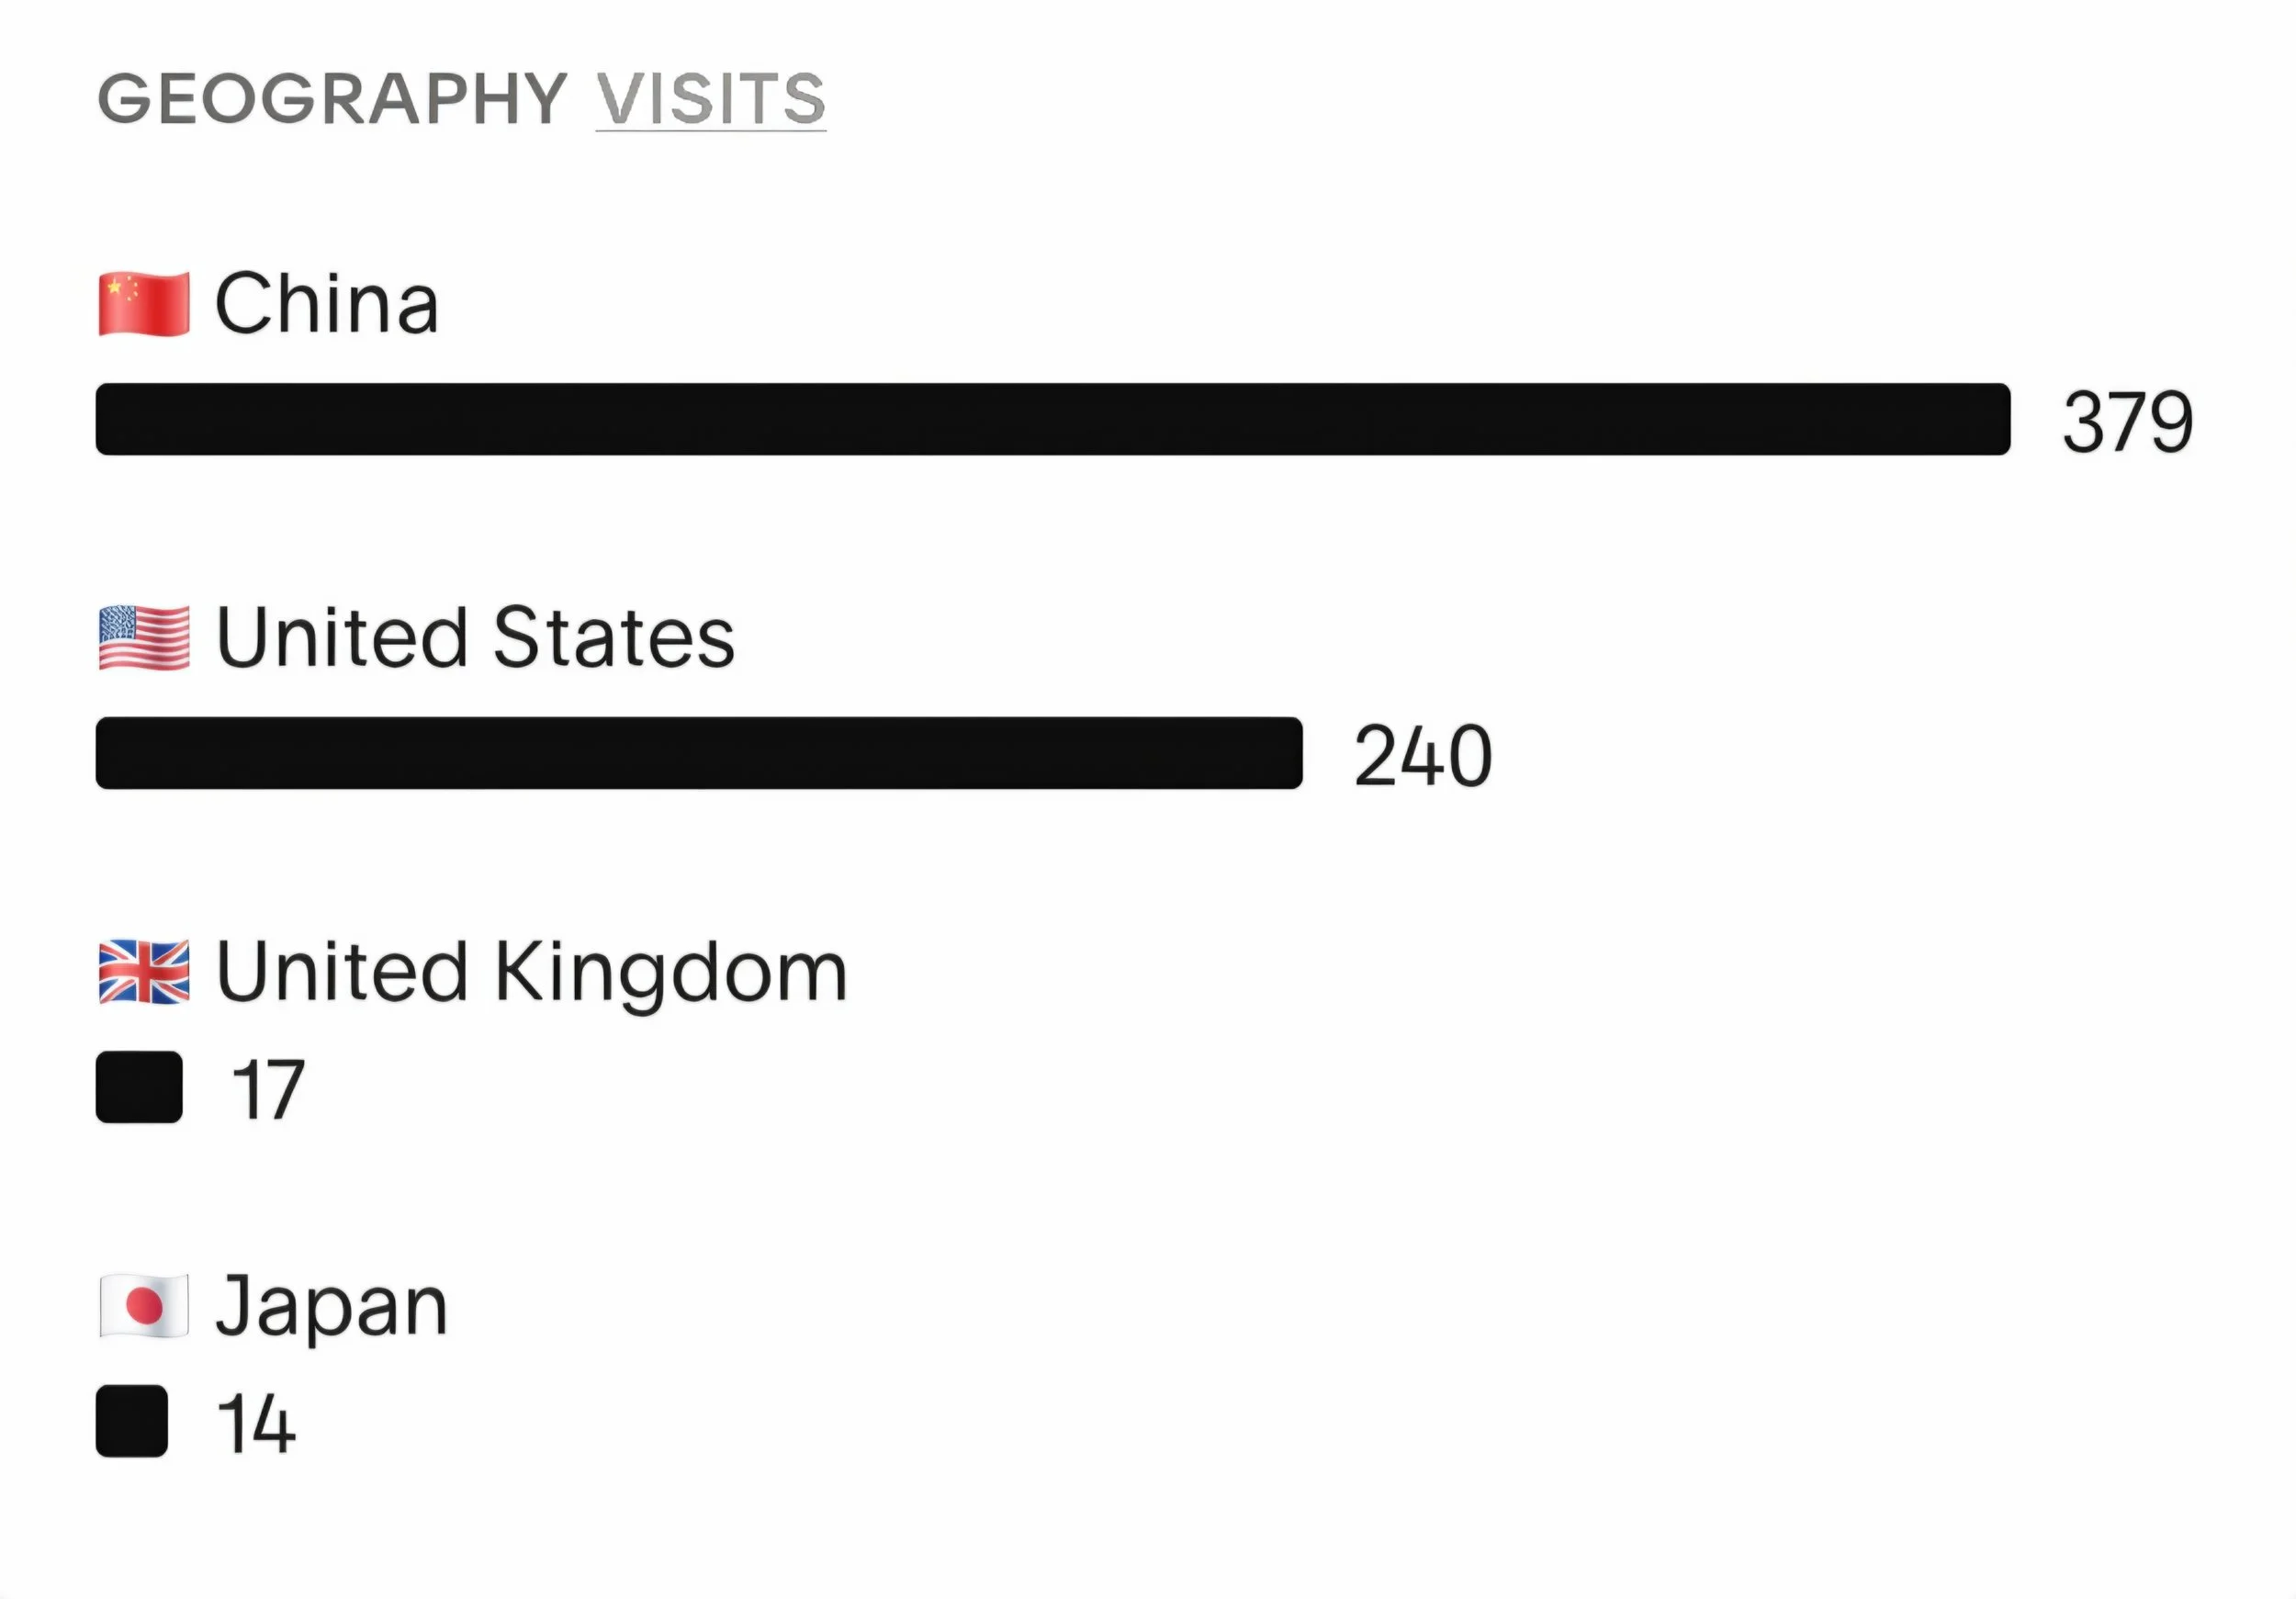
After Russian came German, Japanese, and Chinese, even though most of my overall traffic still comes from China.
I honestly don't know what to make of that yet, but it's fascinating to watch.
The analytics raise more questions than answers, and that's part of the fun.
For those who have followed along, you already know this isn't my profession.
I'm not a programmer.
I'm not a marketer.
I'm not in corporate communications.
I'm just someone with life experiences, stories, opinions, recovery, movie reviews, technology observations, customer service experiences, and the occasional questionable joke that I hope connects with someone somewhere in the world.
If something resonates with you, fantastic.
If something doesn't, I'd like to know that too.
I'd love your feedback.
Leave a comment on the site or email me at niel@nielflamm.com.
Please tell me what you like.
Please tell me what you skip.
Please tell me what you'd like to see more of.
This website has always been about starting conversations, and I hope we keep having them.
Thank you for being part of the journey.
Here's to next month's numbers... hopefully they're pointing in the other direction.
Help Shape the Future of NielFlamm.com
I'm extending my open reader survey and would love your feedback!
If you've visited NielFlamm.com, watched a video, or read a blog post, I'd appreciate hearing what keeps you coming back—and what you'd like to see more of.
The survey is anonymous, takes less than 1 minute to complete, and your feedback will help shape future content.
Take the survey here:
https://forms.office.com/r/WPQAzYLsgs
Thank you for taking a minute to share your thoughts!
Help Shape the Future of NielFlamm.com: A Global Audience Survey 🌎
One of the biggest surprises since launching NielFlamm.com has been discovering that people from around the world are reading and watching my content.
Yes, I expected readers from the United States, but I was genuinely surprised to see engagement from countries across the globe — including a significant audience from China.
That made me ask:
Who are you?
What brings you back?
What content do you enjoy?
What would you like to see more of?
So I created a quick audience survey.
It takes less than a minute to complete:
📋 https://forms.cloud.microsoft/r/WPQAzYLsgs
Whether you are in the United States, China, Europe, Asia, Africa, South America, Australia, or anywhere else in the world, I would love your feedback.
Your responses will help me create better:
✅ Blog posts
✅ Videos
✅ Reviews
✅ Discussions
✅ Future content ideas
Most creators publish and hope people enjoy what they make.
I want to take a different approach.
I want to listen to the people who spend their time reading, watching, and engaging with my content. I want this to be a conversation, not just a broadcast.
And while we’re talking about global audiences…
I’m putting out an invitation.
I would love to partner with a Chinese company interested in reaching a Western audience.
Maybe it’s a Chinese electric vehicle company. 🚗⚡
Maybe it’s a technology brand. 💻
Maybe it’s a fun snack company. 🍜
BYD (Build Your Dreams), Xiaomi Technology, Polestar, or another innovative company — my inbox is open.
As a self-described “WaSian” (White + Asian), I believe I bring a unique perspective: someone who appreciates both Western and Asian influences while sharing authentic experiences with a global audience.
Also… I’m officially putting C-Pop into the universe. 😎
We have K-Pop. We have J-Pop. Why not C-Pop? Chinese music, entertainment, culture, food, and innovation deserve more global attention.
A creator asking an audience what they want to see isn’t complicated.
But maybe it is a different way of creating.
Let’s build something together.
Take the survey. Share your thoughts. Help shape what’s next.
Join the discussion on NielFlamm.com.