
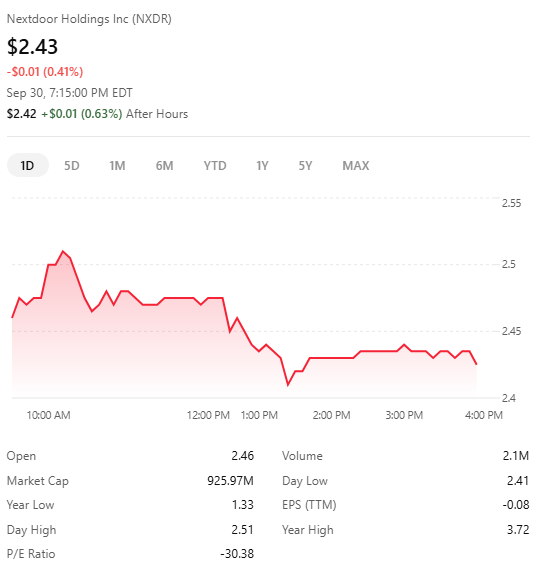
Day 107: NXDR Ends at $2.43 — What Is the Market Telling Us?

Day 107.
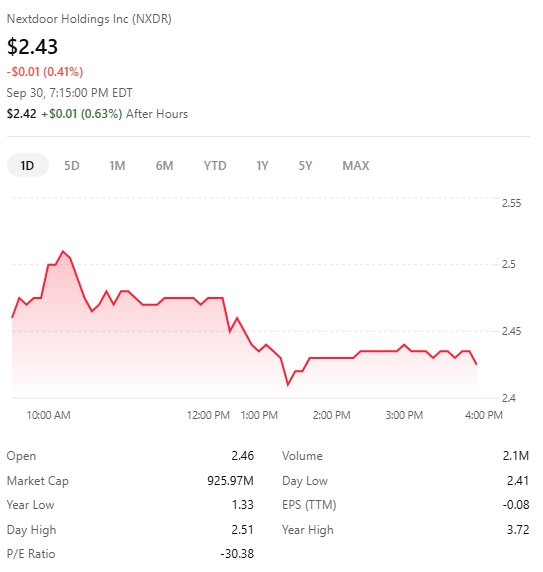
Today, Nextdoor Holdings (NXDR) finished at $2.43 per share, down slightly from Tuesday's $2.45 close. The stock traded between $2.41 and $2.52 during the session, with roughly 2.14 million shares changing hands.
One day doesn't tell the whole story.
The longer-term picture in the chart I've been watching is considerably more interesting.
A Year of Ups, Downs and Plenty in Between
Look at the one-year chart I included with this post.
NXDR has spent portions of the period down around the $2 range, while at other points it approached the upper $2.60s.
More recently, the movement has been just as interesting.
NXDR closed at $2.15 on September 9. By September 21, it had climbed to $2.64. It then fell to $2.38 on September 23, recovered to $2.51 on September 25, and finished September at $2.43.
That's quite a ride for a stock trading for less than $3.
And as a shareholder, it raises a question I've been asking throughout this Nextdoor case study:
What ultimately moves confidence in a company?
A Stock Price Isn't a Corporate Report Card
I want to be careful here.
A stock going up doesn't automatically mean management is doing everything right.
A stock going down doesn't automatically mean management is doing everything wrong.
And I'm certainly not going to look at today's two-cent decline and announce:
“The market has spoken about Nirav Tolia!”
😂
That's not how markets work.
Stock prices can move because of company financial results, expectations about future results, analyst opinions, broader market conditions, trading activity, liquidity, news, investor sentiment, and countless other factors.
NXDR itself demonstrates how quickly those expectations can change. In August, following its second-quarter results, analysts changed their views and price targets. More recently, NXDR has continued moving around considerably from session to session.
I can't attribute a specific Nextdoor decision to a particular movement on this chart.
No one else can either without evidence connecting the two.
But Confidence Still Matters
The chart still matters for my longer-term case study.
Markets ultimately involve people deciding what they believe something is worth.
And those decisions can include much more than yesterday's closing price.
Investors can consider:
Results. Strategy. Growth. Profitability. Execution. Leadership. Communication. Governance. Risk. And expectations about what happens next.
That's where confidence comes in.
A company can announce a brilliant strategy, but eventually investors can look for evidence that it worked.
A CEO can communicate a compelling vision, but eventually shareholders can compare that vision with results.
Management can make decisions that look strange today and brilliant two years from now.
Or the reverse.
Time has an interesting way of grading decisions.

That's Why I Keep Coming Back to Results
I've spent 107 days documenting my experience with Nextdoor.
I've asked about the detailed Insights data.
I've written about communication.
I've questioned transparency.
I've discussed moderation.
I've written about small businesses.
I've questioned how awards are judged.
I've discussed the economic value of neighbor-generated information.
I've praised Nextdoor when I thought it deserved praise.
I've provided feedback when I saw room for improvement.
That doesn’t mean today's $2.43 closing price validates my opinions.
It doesn't.
Likewise, if NXDR jumps to $3 tomorrow, that wouldn't suddenly invalidate the questions I've been asking.
What matters to me as a shareholder is what happens over time.
Decisions → Results → Confidence
Maybe that's the simplest way I can describe what I'm watching.
Leadership makes decisions.
Those decisions eventually produce results.
Those results can influence expectations.
And expectations can affect how investors value the company.
Not necessarily today.
Not necessarily tomorrow.
And certainly not because of one blog post, one executive interview, one Insights report, or one awkward email exchange.
But over time, execution has consequences.
That's why I'm interested in more than whether NXDR is green or red when I open the chart.
I'm interested in the decisions underneath it.
$2.43 Is Just Today's Number
Tomorrow it could be $2.35.
It could be $2.55.
Eventually it could be considerably higher—or considerably lower.
I don't know.
What I do know is that today's number becomes another point on that purple line.
$2.43.
Another trading day.
Another data point.
And another opportunity to remember that the market doesn't permanently value a company based on what leadership says it intends to accomplish.
Over the long run, investors also get to examine what actually happened.
That's the part of the chart I'll continue watching.
Day 107.
NXDR closes September at $2.43.
Let's see where the decisions, results, and confidence take it next.
👉 NielFlamm.com/blog